
Archivo:Late 2006 Philippine typhoon tracks.png
Tamaño de esta previsualización: 800 × 494 píxeles. Otras resoluciones: 320 × 198 píxeles · 640 × 396 píxeles · 1024 × 633 píxeles · 1280 × 791 píxeles · 3000 × 1854 píxeles.
Ver la imagen en su resolución original (3000 × 1854 píxeles; tamaño de archivo: 1,68 MB; tipo MIME: image/png)
| Descripción |
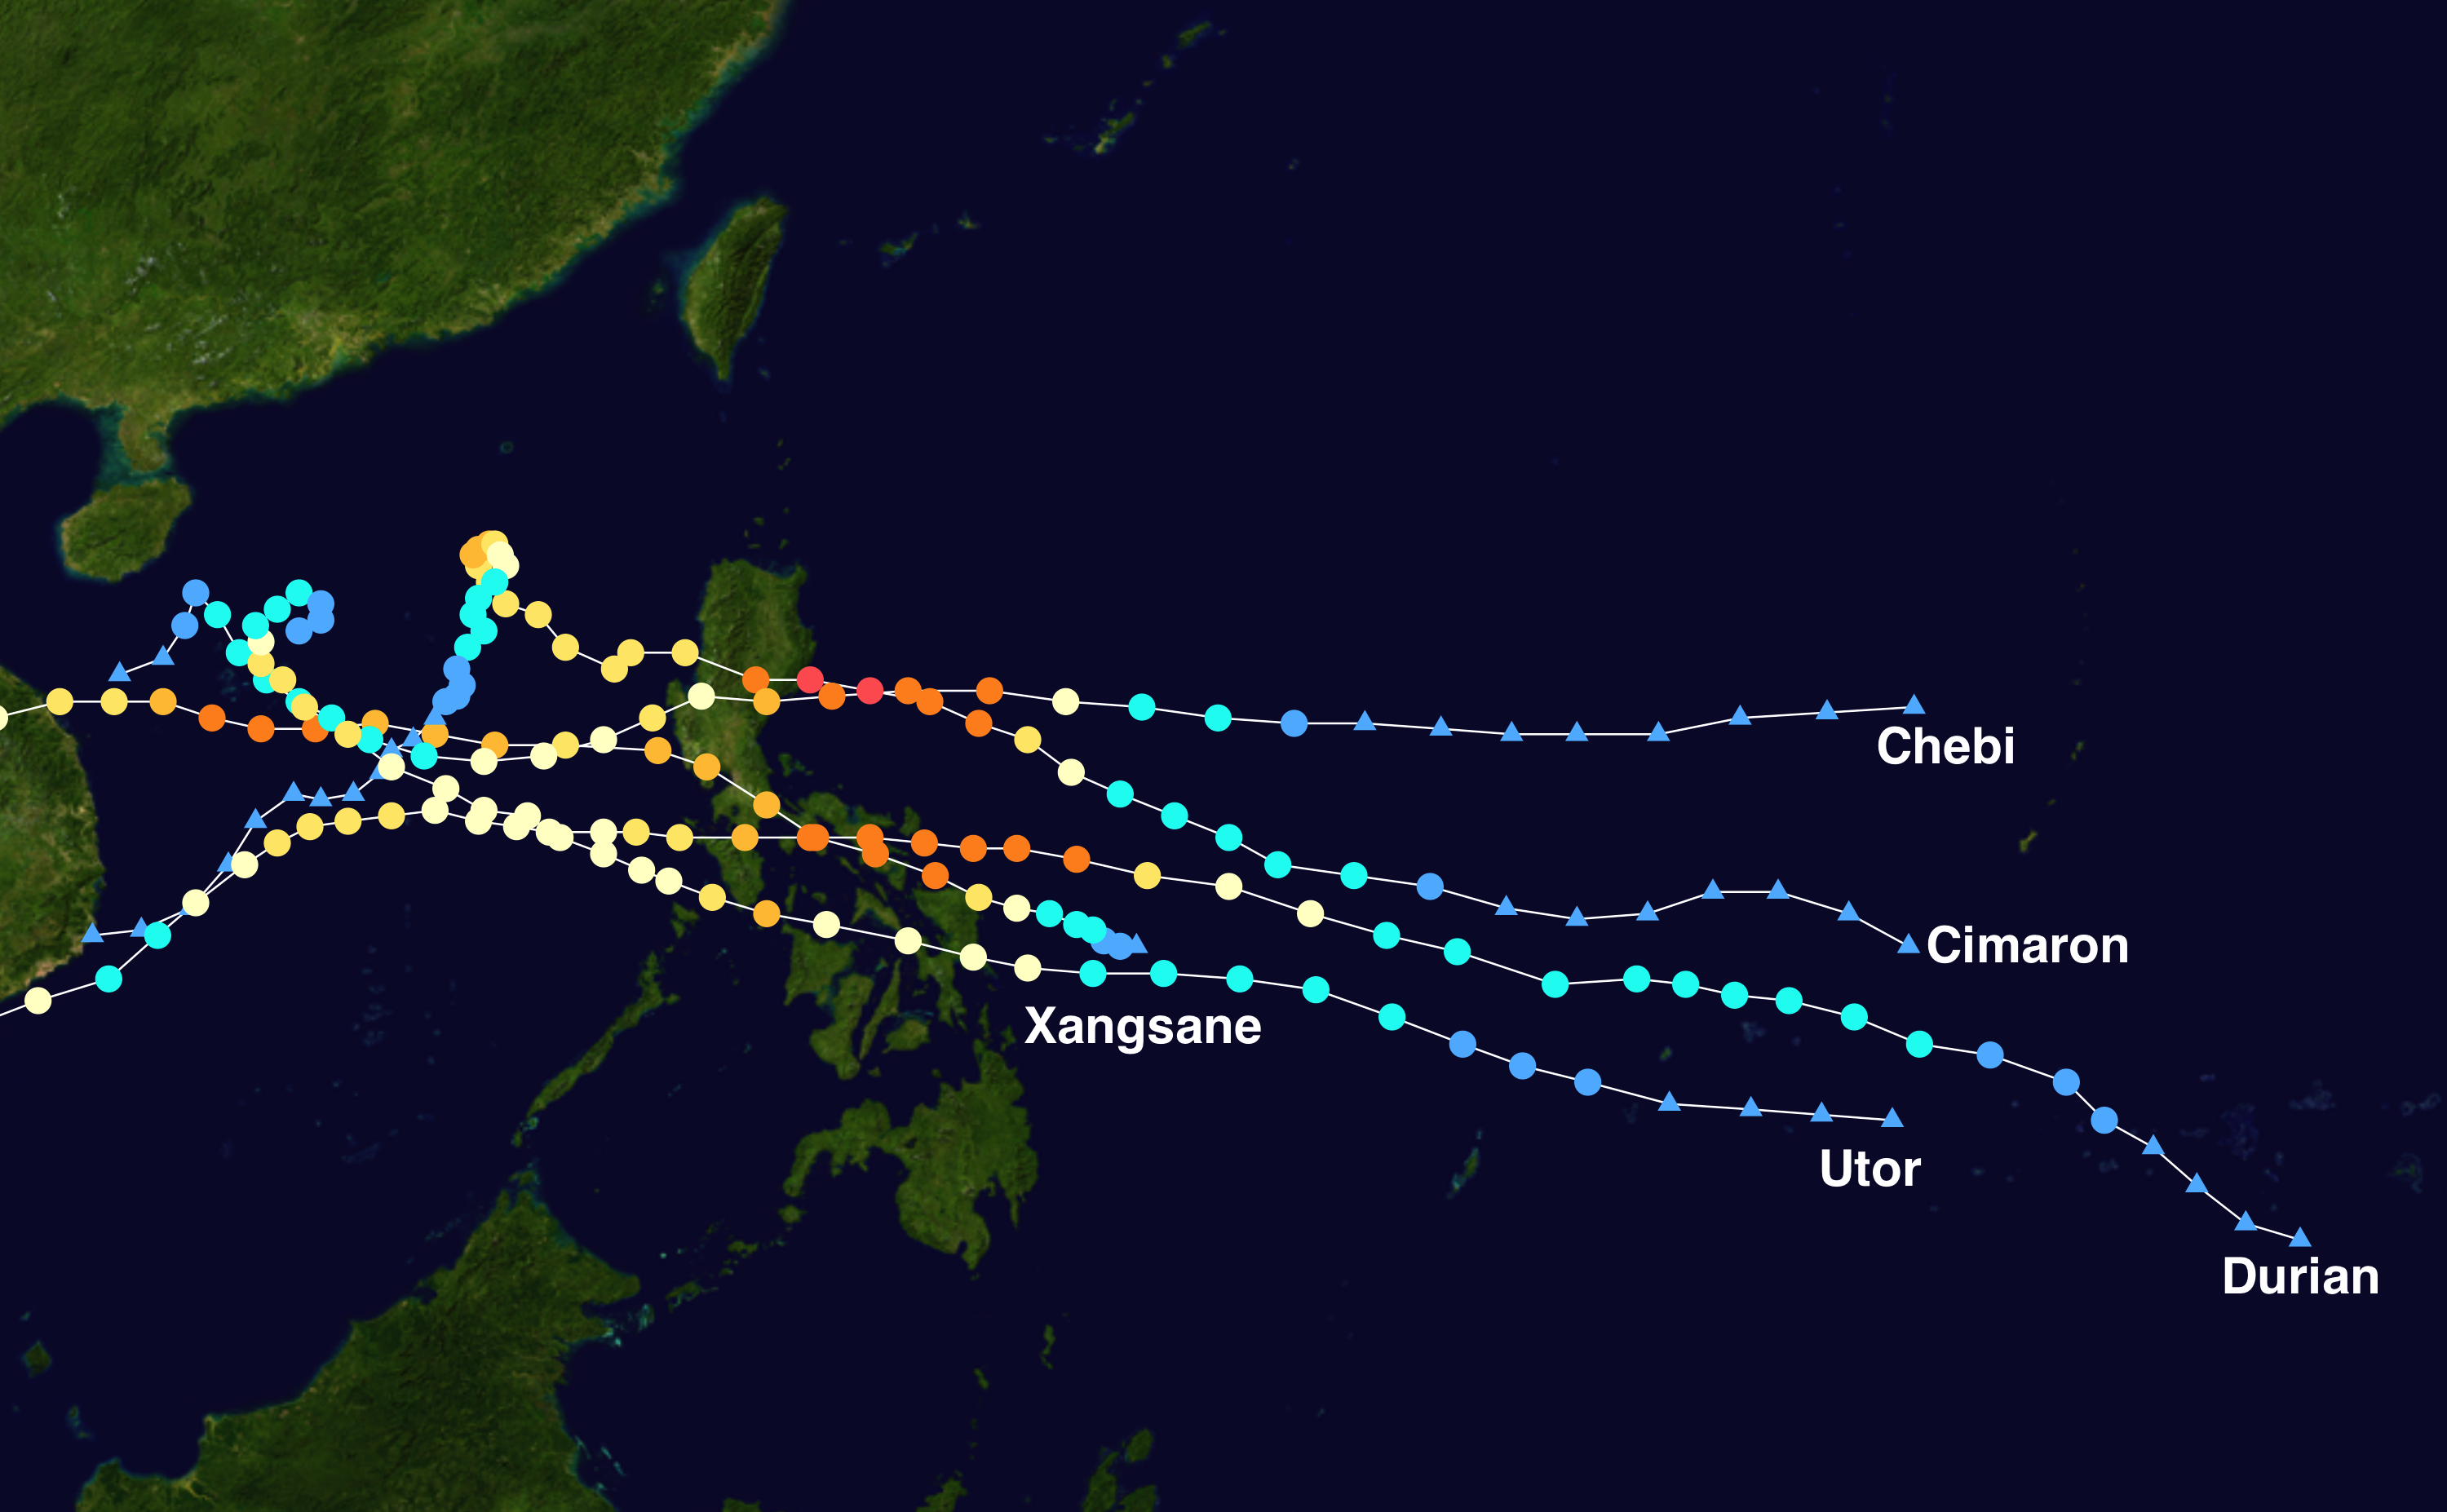
English: Track map of the five successive typhoons that struck the Philippines between September and December 2006. The points show the location of the storm at 6-hour intervals. The color represents the storm's maximum sustained wind speeds as classified in the Saffir-Simpson Hurricane Scale (see below), and the shape of the data points represent the nature of the storm, according to the legend below.
Tropical depression (≤38 mph, ≤62 km/h)
Tropical storm (39–73 mph, 63–118 km/h)
Category 1 (74–95 mph, 119–153 km/h)
Category 2 (96–110 mph, 154–177 km/h)
Category 3 (111–129 mph, 178–208 km/h)
Category 4 (130–156 mph, 209–251 km/h)
Category 5 (≥157 mph, ≥252 km/h)
Unknown
Storm type |
| Fecha | |
| Fuente | The background image is from NASA. Tracking data is from JTWC. |
| Autor | Cyclonebiskit |
| Yo, el titular de los derechos de autor de esta obra, lo libero al dominio público. Esto aplica en todo el mundo. En algunos países esto puede no ser legalmente factible; si ello ocurriese: Concedo a cualquier persona el derecho de usar este trabajo para cualquier propósito, sin ningún tipo de condición al menos que éstas sean requeridas por la ley. |
Historial del archivo
Haz clic sobre una fecha y hora para ver el archivo tal como apareció en ese momento.
| Fecha y hora | Miniatura | Dimensiones | Usuario | Comentario | |
|---|---|---|---|---|---|
| actual | 13:09 22 jul 2013 | | 3000 × 1854 (1,68 MB) | Cyclonebiskit | {{Information |Description={{en|Track map of the five successive typhoons that struck the Philippines between September and December 2006. The points show the location of the storm at 6-hour intervals. The color represents the storm's [[:w:maximum sust... |
Usos del archivo
La siguiente página usa este archivo:
Uso global del archivo
Las wikis siguientes utilizan este archivo:
- Uso en en.wikipedia.org
- Uso en pt.wikipedia.org