
Archivo:Phanerozoic Sea Level.svg

Ver la imagen en su resolución original ((Imagen SVG, nominalmente 523 × 360 pixels, tamaño de archivo: 34 kB))
Resumen
| Descripción |
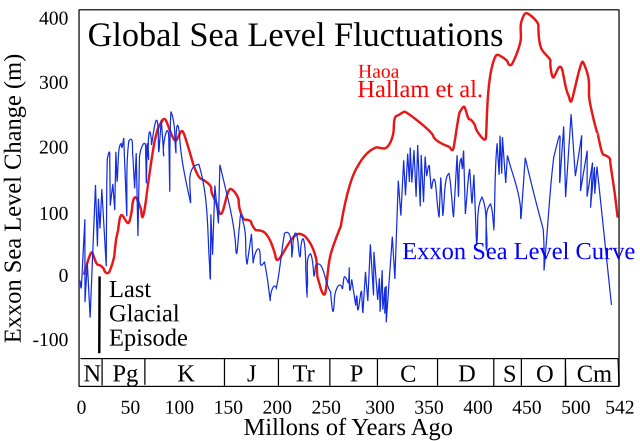
This figure compares the Hallam et al. (1983) and Exxon eustatic (global) sea level reconstructions for the Phanerozoic eon. The Exxon curve [1] is a composite from several reconstructions published by the Exxon corporation (Haq et al. 1987, Ross & Ross 1987, Ross & Ross 1988). Both curves are adjusted to the 2004 ICS geologic timescale. Hallam et al. and Exxon use very different techniques to measuring global sea level changes. Hallam's approach is qualitative and relies on regional scale observations from exposed geologic sections and estimates of the areas of flooded continental interiors. Exxon's approach relies on the interpretation of seismic profiles to determine the extent of coastal onlap in subsequently buried sedimentary basins. Hallam is insensitive to rapid fluctuations in sea level. Exxon is sensitive to rapid fluctuations but tends to overinterpret local geologic changes resulting in bias towards reporting unphysical rapid fluctuations. The depth scale is as reported by Exxon. Because Hallam is reported as qualtitative (i.e. uncalibrated), these sea level changes were scaled to match the Exxon record during the period 0-250 Myr. A black bar is added to indicate the scale of sea level fluctuations during the last glacial/interglacial transition. This change occurred purely within the last 20 kyrs, and note that neither system of measurements is capable of resolving changes on this time scale. It also should be noted that very rapid fluctuations of similar scale are potentially possible during all periods during which large scale ice sheets are present (see: Phanerozoic climate change). On the scale of this figure, the melting of all existing ice sheets would result in a sea level rise of ~80 meters. Changes on larger scales, which evidently occurred many times in the past, are the result of geologic changes in the structure of ocean basins. Essentially, such changes affect the average depth of the oceans relative to the continents. Common symbols for geologic periods appear at the bottom. |
| Fecha | (UTC) |
| Fuente |
Este archivo deriva de: Phanerozoic Sea Level.png: |
| Autor | |
| Otras versiones | File:Phanerozoic Sea Level es.svg |
| Esta es una imagen retocada, lo que significa que ha sido alterada digitalmente de su versión original. Modificaciones: svg. La original se puede ver aquí: Phanerozoic Sea Level.png. Las modificaciones las hizo Esceptic0.
|
Licencia
| Este archivo se encuentra bajo la licencia Creative Commons Genérica de Atribución/Compartir-Igual 3.0. | ||
| ||
| Esta etiqueta de licencia fue agregada a este archivo como parte de la actualización de la licencia GFDL. |

|
Se autoriza la copia, distribución y modificación de este documento bajo los términos de la licencia de documentación libre GNU, versión 1.2 o cualquier otra que posteriormente publique la Fundación para el Software Libre; sin secciones invariables, textos de portada, ni textos de contraportada. Se incluye una copia de la dicha licencia en la sección titulada Licencia de Documentación Libre GNU. |
Registro original de carga
This image is a derivative work of the following images:
- File:Phanerozoic_Sea_Level.png licensed with Cc-by-sa-3.0-migrated, GFDL, GWArt
- 2005-12-27T02:24:34Z Angrense 523x360 (23950 Bytes) Variation of the sea level during the Phanerozoic eon. Source:English versin of Wikipedia.
Uploaded with derivativeFX
References
- Hallam, A., Phil. Trans. Royal Soc. B 325, 437-455 (1989).
- Harland, W.B. and many others, A Geologic Time Scale, (1982).
- Haq, B., J. Hardenbol, P. Vail., Science, 235, 156-1167 (1987).
- Ross, C.A. & J.R.P. Ross, Cushman Foundation for Foraminiferal Research Spec. Publ. 24, 137-149 (1987).
- Ross, C.A. & J.R.P. Ross in Sea-level Change: an Integrated Approach (Eds. Wilgus, C.K., Hastings, B.J., Posamentier, H., van Wagoner, J.C., Ross, C.A., and Kendall, C.G. St. C.), SEPM Spec. Pub. 42:71-108 (1988).
Notes
- Because Exxon traditionally used an in-house (i.e. unpublished) system for estimating the geologic age of stratigraphic sections it is not possible to perform an exact recalibration of the time scale. Instead it was adjusted assuming the Harland et al. 1982 time scale was a reasonable approximation.
Historial del archivo
Haz clic sobre una fecha y hora para ver el archivo tal como apareció en ese momento.
| Fecha y hora | Miniatura | Dimensiones | Usuario | Comentario | |
|---|---|---|---|---|---|
| actual | 02:23 16 ago 2012 | | 523 × 360 (34 kB) | AnonMoos | fixing Inkscape flowtext nonsense |
| 01:09 16 ago 2012 |  | 523 × 360 (37 kB) | Esceptic0 | == {{int:filedesc}} == {{Information |Description= This figure compares the Hallam et al. (1983) and Exxon eustatic (global) sea level reconstructions for the Phanerozoic eon. The Exx... |
Usos del archivo
La siguiente página usa este archivo:
Uso global del archivo
Las wikis siguientes utilizan este archivo:
- Uso en de.wikipedia.org
- Uso en en.wikipedia.org
- Uso en no.wikipedia.org
- Uso en tr.wikipedia.org
- Uso en uk.wikipedia.org