
Archivo:Roscoe surface.svg

Tamaño de esta previsualización PNG del archivo SVG: 800 × 600 píxeles. Otras resoluciones: 320 × 240 píxeles · 640 × 480 píxeles · 1024 × 768 píxeles · 1280 × 960 píxeles · 2560 × 1920 píxeles.
Ver la imagen en su resolución original ((Imagen SVG, nominalmente 1280 × 960 pixels, tamaño de archivo: 765 kB))
Resumen
| Descripción |
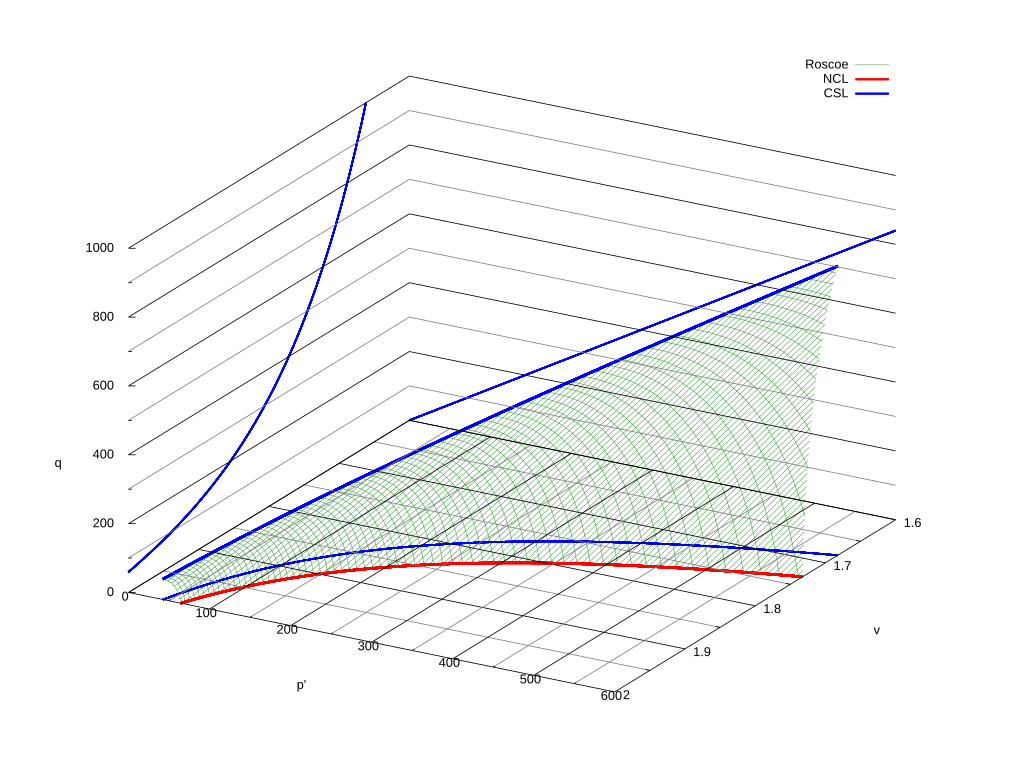
English: Roscoe Surface, plotted by Cambridge Method.
Lines on Roscoe Surface shows same line as each stress paths, which is parallel to axis p' for Consolidated Undrain(CU), non-parallel for Consolidated Drain(CD). Symbols on this figure are defined as followings.
日本語: ロスコー面(ケンブリッジ法でプロット)。
ロスコー面上の各線はそれぞれ応力径路に対応しており、p'軸に平行なものが圧密非排水(CU)、平行でないものが圧密排水(CD)。 図中の各記号は以下の通り。
|
| Fecha | |
| Fuente | Trabajo propio |
| Autor | aokomoriuta(青子守歌) |
| Otras versiones |
|


.svg)
.svg)
.svg)
.svg)
Licencia
Yo, titular de los derechos de autor de esta obra, la publico en los términos de las siguientes licencias:
Este archivo se encuentra bajo la licencia Creative Commons Attribution-Share Alike 3.0 Unported, 2.5 Generic, 2.0 Generic and 1.0 Generic
- Eres libre:
- de compartir – de copiar, distribuir y transmitir el trabajo
- de remezclar – de adaptar el trabajo
- Bajo las siguientes condiciones:
- atribución – Debes otorgar el crédito correspondiente, proporcionar un enlace a la licencia e indicar si realizaste algún cambio. Puedes hacerlo de cualquier manera razonable pero no de manera que sugiera que el licenciante te respalda a ti o al uso que hagas del trabajo.
- compartir igual – En caso de mezclar, transformar o modificar este trabajo, deberás distribuir el trabajo resultante bajo la misma licencia o una compatible como el original.
| This file is licensed under the Creative Commons Attribution-Noncommercial 3.0 Unported license. | |
|

|
Se autoriza la copia, distribución y modificación de este documento bajo los términos de la licencia de documentación libre GNU, versión 1.2 o cualquier otra que posteriormente publique la Fundación para el Software Libre; sin secciones invariables, textos de portada, ni textos de contraportada. Se incluye una copia de la dicha licencia en la sección titulada Licencia de Documentación Libre GNU. |
Puedes usar la licencia que prefieras.
gnuplot code
English: All source code are also available same license as this file.
日本語: ソースコードはファイルと同じライセンスで利用可能です。
roscoe.plt
# parametric with p&v
set parametric
set dummy p,v

# constant
N = 2.5
lambda = 0.12
gamma = 2.45
M= 1.40

p0 = 200

#function
NCL(p) = N - lambda * log(p)        # v
NCL_p(v) = exp((N - v)/lambda)      # p

CSL1(p) = gamma - lambda * log(p)   # v
CSL2(p) = M * p                     # q
CSL3(v) = M * exp((gamma-v)/lambda) # q

CSL1_p(v) = exp((gamma - v)/lambda) # p

CSL_CU_p(p0) = p0 * exp((gamma - N)/lambda)
CSL_CU_v(p0) = NCL(p0)
CSL_CU_q(p0) = CSL2(CSL_CU_p(p0))

CSL_CD_p(p0) = 1/(1-M/3.0) * p0
CSL_CD_v(p0) = CSL1(CSL_CD_p(p0))
CSL_CD_q(p0) = CSL2(CSL_CD_p(p0))

#other constant
vtics = 0.1
ptics = 100
qtics = 200

max_v = ceil(NCL(100)     /vtics)*vtics
max_p = ceil(CSL_CD_p(300)/ptics)*ptics
max_q = ceil(CSL2(max_p)  /qtics)*qtics

min_v = int(CSL1(max_p) * 0.98 /vtics)*vtics
min_p = 0
min_q = 0

max_x1 = max_p
max_x2 = max_v

min_x1 = -1
min_x2 = min_v

#range
set urange[min_x1:max_x1] # p
set vrange[min_x2:max_x2] # v

set xrange[min_v:max_v] # p
set yrange[min_p:max_p] # v
set zrange[min_q:max_q] # q

#ticslevel
set ticslevel 0

#label
set xlabel "v"
set ylabel "p'"
set zlabel "q"

#grid
set xtics vtics nomirror
set ytics ptics nomirror
set ztics qtics nomirror
set mxtics 2
set mytics 2
set mztics 2
set grid xtics ytics ztics mxtics mytics mztics front lt -1 lw 1, lt 0 lw 1

#border
unset border

# surface settings
set isosample 100
set view 60,120,1,1

# stress path
SP_p(p0, v) = p0 + (CSL_CD_p(p0) - p0) * (v  - NCL(p0))/(CSL_CD_v(p0) - NCL(p0))
SP_v(p0, v) = (v > NCL(p0)) ? NCL(p0) : ((v < CSL_CD_v(p0))? CSL_CD_v(p0) : v)
SP_q(p0, v) = CSL_CD_q(p0) * (v - NCL(p0)) / (CSL_CD_v(p0) - NCL(p0))

# plot
splot  SP_v(p, v), SP_p(p, SP_v(p, v)), SP_q(p, SP_v(p, v)) title "Roscoe" ls 2 lw 0.5, \
           NCL(p), p,       0 title "NCL" ls 1 lw 3, \
          CSL1(p), p,       0 notitle     ls 3 lw 2, \
            min_v, p, CSL2(p) notitle     ls 3 lw 2, \
                v, 0, CSL3(v) notitle     ls 3 lw 2, \
          CSL1(p), p, CSL2(p) title "CSL" ls 3 lw 3

# create gif

theta = 0
set terminal gif notransparent size 1280, 960 font "Times New Roman"

load "roscoe_loop.plt"

set output
set terminal wxt
roscoe_loop.plt
set view 60,theta,1,1

set output sprintf("roscoe%3d.gif", theta)

replot

theta = theta + 5
if(theta<360) reread
Historial del archivo
Haz clic sobre una fecha y hora para ver el archivo tal como apareció en ese momento.
| Fecha y hora | Miniatura | Dimensiones | Usuario | Comentario | |
|---|---|---|---|---|---|
| actual | 12:20 20 abr 2011 | | 1280 × 960 (765 kB) | 青子守歌 | == {{int:filedesc}} == {{User:青子守歌/own work/information|File=Figures |en=Roscoe Surface, plotted by Cambridge Method. Lines on Roscoe Surface shows same line as each stress paths, which is parallel to axis p' for Consolidated Undrain(CU), non-para |
Usos del archivo
La siguiente página usa este archivo:
Uso global del archivo
Las wikis siguientes utilizan este archivo:
- Uso en en.wikipedia.org
- Uso en ja.wikipedia.org