
Archivo:U.S. Household Debt Relative to Disposable Income and GDP.png
Ver la imagen en su resolución original (960 × 720 píxeles; tamaño de archivo: 10 kB; tipo MIME: image/png)
Resumen
| Descripción |
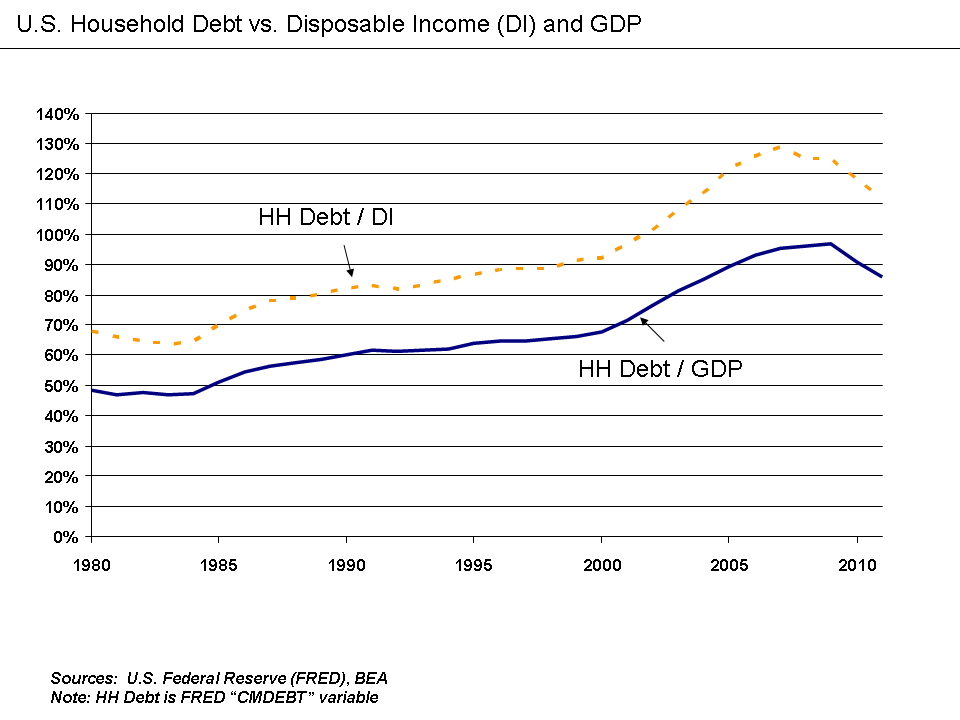
English: U.S. Household Debt Relative to Disposable Income and GDP 1980-2011 |
| Fecha | |
| Fuente | Trabajo propio |
| Autor | Farcaster |
Understanding the chart
This chart shows how U.S. household (HH) debt (measured by the FRED variable "CMDEBT") rose relative to both GDP and disposable income over the 1980 to 2011 period.
- Household debt as a % disposable income rose from 68% in 1980 to a peak of 128% in 2007, prior to dropping to 112% by 2011.
- Household debt as a % GDP rose from 49% in 1980 to a peak of 97% in 2009, prior to dropping to 86% in 2011.
This chart uses the Federal Reserve Database (FRED) to obtain the CMDEBT variable.[1]
Disposable income data is available from the Bureau of Economic Analysis (BEA).[2]
GDP data is available from the Bureau of Economic Analysis (BEA).[3]
Paul Krugman wrote in December 2010: "The root of our current troubles lies in the debt American families ran up during the Bush-era housing bubble. Twenty years ago, the average American household’s debt was 83 percent of its income; by a decade ago, that had crept up to 92 percent; but by late 2007, debts were 130 percent of income. All this borrowing took place both because banks had abandoned any notion of sound lending and because everyone assumed that house prices would never fall. And then the bubble burst. What we’ve been dealing with ever since is a painful process of “deleveraging”: highly indebted Americans not only can’t spend the way they used to, they’re having to pay down the debts they ran up in the bubble years. This would be fine if someone else were taking up the slack. But what’s actually happening is that some people are spending much less while nobody is spending more — and this translates into a depressed economy and high unemployment. What the government should be doing in this situation is spending more while the private sector is spending less, supporting employment while those debts are paid down. And this government spending needs to be sustained: we’re not talking about a brief burst of aid; we’re talking about spending that lasts long enough for households to get their debts back under control. The original Obama stimulus wasn’t just too small; it was also much too short-lived, with much of the positive effect already gone."[4]
This increase in debt during the period enabled spending that stimulated the economy (arguably hiding the true state of the economy). This debt overhang then began holding back the economy as consumers paid down debt (which reduces economic activity) rather than spend.[5]
During April 2009, U.S. Federal Reserve Vice Chair Janet Yellen discussed the situation: "Once this massive credit crunch hit, it didn’t take long before we were in a recession. The recession, in turn, deepened the credit crunch as demand and employment fell, and credit losses of financial institutions surged. Indeed, we have been in the grips of precisely this adverse feedback loop for more than a year. A process of balance sheet deleveraging has spread to nearly every corner of the economy. Consumers are pulling back on purchases, especially on durable goods, to build their savings. Businesses are cancelling planned investments and laying off workers to preserve cash. And, financial institutions are shrinking assets to bolster capital and improve their chances of weathering the current storm. Once again, Minsky understood this dynamic. He spoke of the paradox of deleveraging, in which precautions that may be smart for individuals and firms—and indeed essential to return the economy to a normal state—nevertheless magnify the distress of the economy as a whole."[6]
References
Licencia

|
Se autoriza la copia, distribución y modificación de este documento bajo los términos de la licencia de documentación libre GNU, versión 1.2 o cualquier otra que posteriormente publique la Fundación para el Software Libre; sin secciones invariables, textos de portada, ni textos de contraportada. Se incluye una copia de la dicha licencia en la sección titulada Licencia de Documentación Libre GNU. |
- Eres libre:
- de compartir – de copiar, distribuir y transmitir el trabajo
- de remezclar – de adaptar el trabajo
- Bajo las siguientes condiciones:
- atribución – Debes otorgar el crédito correspondiente, proporcionar un enlace a la licencia e indicar si realizaste algún cambio. Puedes hacerlo de cualquier manera razonable pero no de manera que sugiera que el licenciante te respalda a ti o al uso que hagas del trabajo.
- compartir igual – En caso de mezclar, transformar o modificar este trabajo, deberás distribuir el trabajo resultante bajo la misma licencia o una compatible como el original.
Registro original de carga
- 2012-07-12 12:49 Farcaster 960×720× (10312 bytes) Uploading a self-made file using [[Wikipedia:File_Upload_Wizard|File Upload Wizard]]
Historial del archivo
Haz clic sobre una fecha y hora para ver el archivo tal como apareció en ese momento.
| Fecha y hora | Miniatura | Dimensiones | Usuario | Comentario | |
|---|---|---|---|---|---|
| actual | 13:15 17 jul 2012 | | 960 × 720 (10 kB) | File Upload Bot (Magnus Manske) | Transfered from en.wikipedia by User:Sfan00_IMG using CommonsHelper |
Usos del archivo
La siguiente página usa este archivo:
Uso global del archivo
Las wikis siguientes utilizan este archivo:
- Uso en en.wikipedia.org
- Uso en fa.wikipedia.org
- Uso en hy.wikipedia.org
- Uso en it.wikipedia.org
- Uso en ja.wikipedia.org
- Uso en ko.wikipedia.org
- Uso en vi.wikipedia.org
- Uso en zh.wikipedia.org