Archivo:1981–1989 monthly unemployment, inflation, and interest rates.svg

Contenido de la página no disponible en otros idiomas.
De Wikipedia, la enciclopedia libre

Ver la imagen en su resolución original((Imagen SVG, nominalmente 1000 × 750 pixels, tamaño de archivo: 7 kB))

Resumen

Descripción
English: Line charts on the monthly unemployment, inflation, and interest rates from January 1981 to January 1989:
General concept above; examples below.
Warming stripes
(five examples compared)
Warming stripes bar chart
Bar chart (vertical)
Pie chart
Line charts
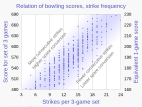
Scatterplot

I've uploaded .xlsx (Microsoft Excel) spreadsheets that automatically generate XML code for charts in SVG format.

You simply paste or enter your data into the spreadsheet, and specify image dimensions, number of grid lines, font sizes, etc. The spreadsheet instantly and automatically generates a column of XML code that you simply copy and paste into a text editor and save as an ".svg" file. The spreadsheets produce lean SVG code, avoiding the "extra stuff" that Inkscape inserts. They should save you time in creating SVG charts.

Feedback and suggestions on my talk page are welcome. RCraig09 (discusión) 23:41, 19 February 2021 (UTC)

Click HOW TO for detailed explanation.
Click HERE (else HERE) to download the spreadsheets.
  1. Warming stripes — Accepts a single dataset and converts to SVG code portraying Ed Hawkins' warming stripes graphics. User chooses vertical or horizontal stripes; normal or reverse data ordering; or from a variety of geometric shapes (updated 17 May 2023). . . . . Click here to see examples of warming stripes embedded in different shapes.
  2. Warming stripes bar chart — Accepts a single dataset and creates a conventional bar chart whose individual bars/columns are coloured according to Dr. Hawkins' warming stripes colour scheme. Alternate option: choose one colour for ascending bars and another colour for descending bars. (updated 28 August 2023)
  3. Line charts — Accepts up to six datasets. (updated 30 August 2023)
  4. Vertical bar charts (column charts) — Accepts up to six datasets. Toggle between clustered and stacked charts; user can adjust "Yfloor"—the Y level (usually=0) from which columns rise or fall; user chooses to keep or ignore negative input values. (updated 27 August 2023)
  5. Horizontal bar charts — Accepts up to six datasets. Toggle between clustered and stacked charts; user can adjust "Yfloor"—the value (usually=0) from which bars extend; user chooses to keep or ignore negative input values. (updated 27 August 2023)
  6. Scatter plots — Accepts up to five datasets. (updated 28 August 2023)
  7. Pie charts — Accepts a single dataset of up to 36 items. (updated 17 May 2023)
  8. Variable-width bar charts — Accepts up to six datasets; is like "Vertical bar charts", above, but user can choose different widths for different bars. (updated 27 August 2023)
Fecha
Fuente Trabajo propio
Autor Wow

Licencia

Yo, el titular de los derechos de autor de esta obra, la publico en los términos de la siguiente licencia:
w:es:Creative Commons
atribución compartir igual
Este archivo está disponible bajo la licencia Creative Commons Attribution-Share Alike 4.0 International.
Eres libre:
  • de compartir – de copiar, distribuir y transmitir el trabajo
  • de remezclar – de adaptar el trabajo
Bajo las siguientes condiciones:
  • atribución – Debes otorgar el crédito correspondiente, proporcionar un enlace a la licencia e indicar si realizaste algún cambio. Puedes hacerlo de cualquier manera razonable pero no de manera que sugiera que el licenciante te respalda a ti o al uso que hagas del trabajo.
  • compartir igual – En caso de mezclar, transformar o modificar este trabajo, deberás distribuir el trabajo resultante bajo la misma licencia o una compatible como el original.

Leyendas

Añade una explicación corta acerca de lo que representa este archivo
Line charts on the monthly unemployment, inflation, and interest rates from January 1981 to January 1989

Elementos representados en este archivo

representa a

image/svg+xml

42e5b1618aece5ea88270d9e5e9bf17ad592561b

750 píxel

1000 píxel

Historial del archivo

Haz clic sobre una fecha y hora para ver el archivo tal como apareció en ese momento.

Fecha y horaMiniaturaDimensionesUsuarioComentario
actual03:57 10 oct 2023Miniatura de la versión del 03:57 10 oct 20231000 × 750 (7 kB)RCraig09Version 2: adjusted vertical axis so grid lines are associated with round numbers . . . OK to revert to Version 1 if you want; just trying to neaten things up! --RCraig09
10:10 19 ene 2023Miniatura de la versión del 10:10 19 ene 20231000 × 750 (8 kB)WowUploaded own work with UploadWizard

La siguiente página usa este archivo:

Uso global del archivo

Las wikis siguientes utilizan este archivo:

Metadatos