
Archivo:1982- Deaths from mass shootings in the U.S - scatterplot and line chart.svg

Tamaño de esta previsualización PNG del archivo SVG: 800 × 600 píxeles. Otras resoluciones: 320 × 240 píxeles · 640 × 480 píxeles · 1024 × 768 píxeles · 1280 × 960 píxeles · 2560 × 1920 píxeles · 1000 × 750 píxeles.
Ver la imagen en su resolución original ((Imagen SVG, nominalmente 1000 × 750 pixels, tamaño de archivo: 4 kB))
Resumen
| Descripción |
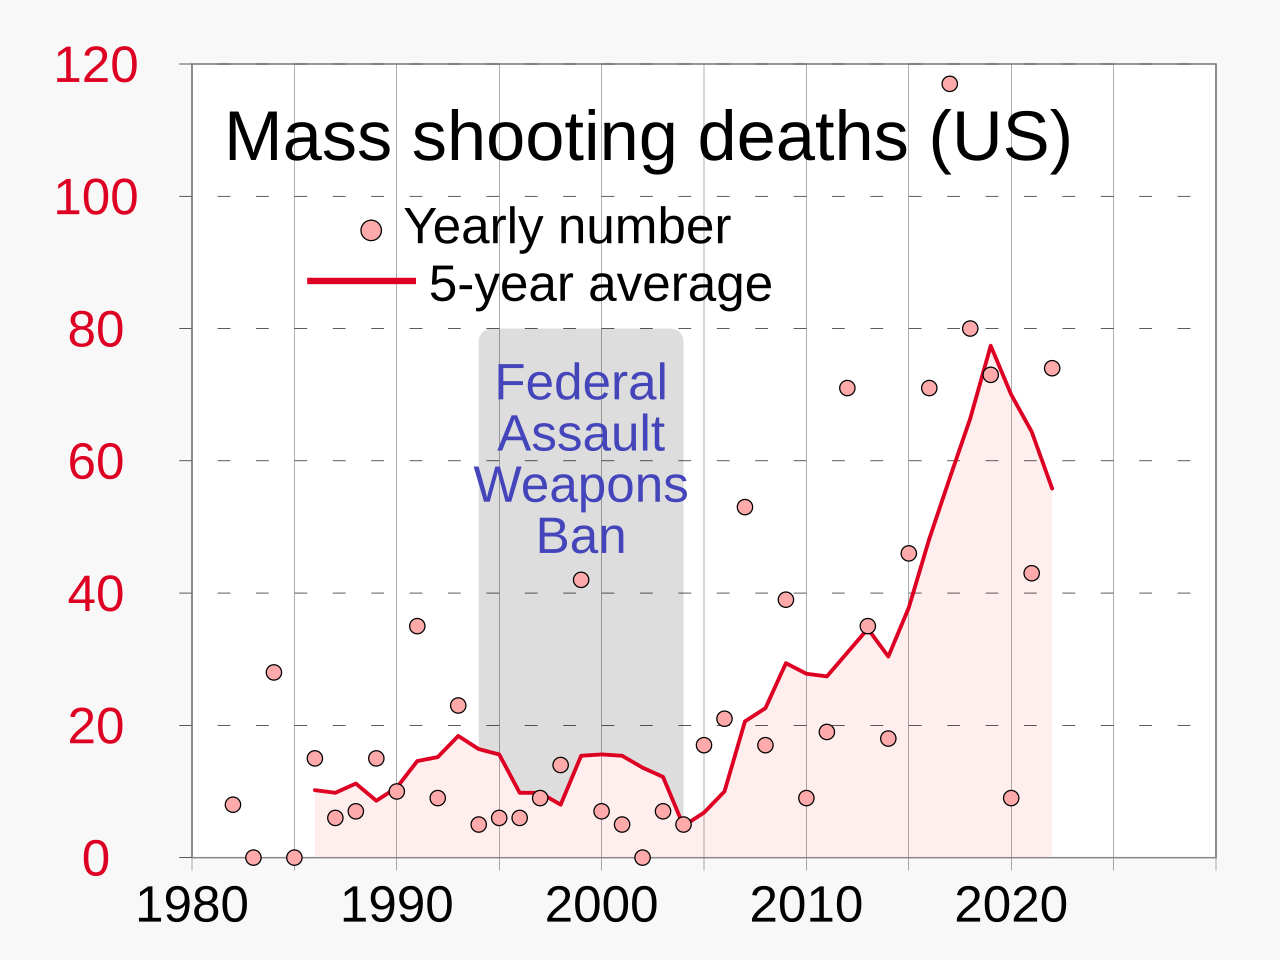
English: Chart showing deaths from mass shootings in the U.S., including 5-year moving average, beginning in 1982
|
||
| Fecha | |||
| Fuente | Trabajo propio | ||
| Autor | RCraig09 |

Related files
-
 Predecessor PNG file
 -
 Predecessor JPG file


Licencia
Yo, el titular de los derechos de autor de esta obra, la publico en los términos de la siguiente licencia:
Este archivo está disponible bajo la licencia Creative Commons Attribution-Share Alike 4.0 International.
- Eres libre:
- de compartir – de copiar, distribuir y transmitir el trabajo
- de remezclar – de adaptar el trabajo
- Bajo las siguientes condiciones:
- atribución – Debes otorgar el crédito correspondiente, proporcionar un enlace a la licencia e indicar si realizaste algún cambio. Puedes hacerlo de cualquier manera razonable pero no de manera que sugiera que el licenciante te respalda a ti o al uso que hagas del trabajo.
- compartir igual – En caso de mezclar, transformar o modificar este trabajo, deberás distribuir el trabajo resultante bajo la misma licencia o una compatible como el original.
Historial del archivo
Haz clic sobre una fecha y hora para ver el archivo tal como apareció en ese momento.
| Fecha y hora | Miniatura | Dimensiones | Usuario | Comentario | |
|---|---|---|---|---|---|
| actual | 04:47 4 abr 2023 | | 1000 × 750 (4 kB) | RCraig09 | Version 3: add to legend |
| 03:46 2 abr 2023 |  | 1000 × 750 (4 kB) | RCraig09 | Version 2: reduce thickness of line trace to be less dominant (compatible with related charts) | |
| 21:43 31 mar 2023 |  | 1000 × 750 (4 kB) | RCraig09 | Uploaded own work with UploadWizard |
Usos del archivo
Las siguientes páginas usan este archivo:
Uso global del archivo
Las wikis siguientes utilizan este archivo:
- Uso en cy.wikipedia.org
- Uso en en.wikipedia.org
- Uso en en.wikiquote.org
- Uso en fr.wikipedia.org
- Uso en he.wikipedia.org
- Uso en id.wikipedia.org
- Uso en it.wikipedia.org
- Uso en ja.wikipedia.org
- Uso en pl.wikipedia.org
- Uso en pt.wikipedia.org
- Uso en ru.wikipedia.org
- Uso en vi.wikipedia.org
- Uso en zh.wikipedia.org