
Archivo:Changes in total solar irradiance and monthly sunspot numbers, 1975-2013.png
Tamaño de esta previsualización: 796 × 600 píxeles. Otras resoluciones: 319 × 240 píxeles · 637 × 480 píxeles · 1020 × 768 píxeles · 1280 × 964 píxeles · 2318 × 1746 píxeles.
Ver la imagen en su resolución original (2318 × 1746 píxeles; tamaño de archivo: 289 kB; tipo MIME: image/png)
Resumen
| Descripción |
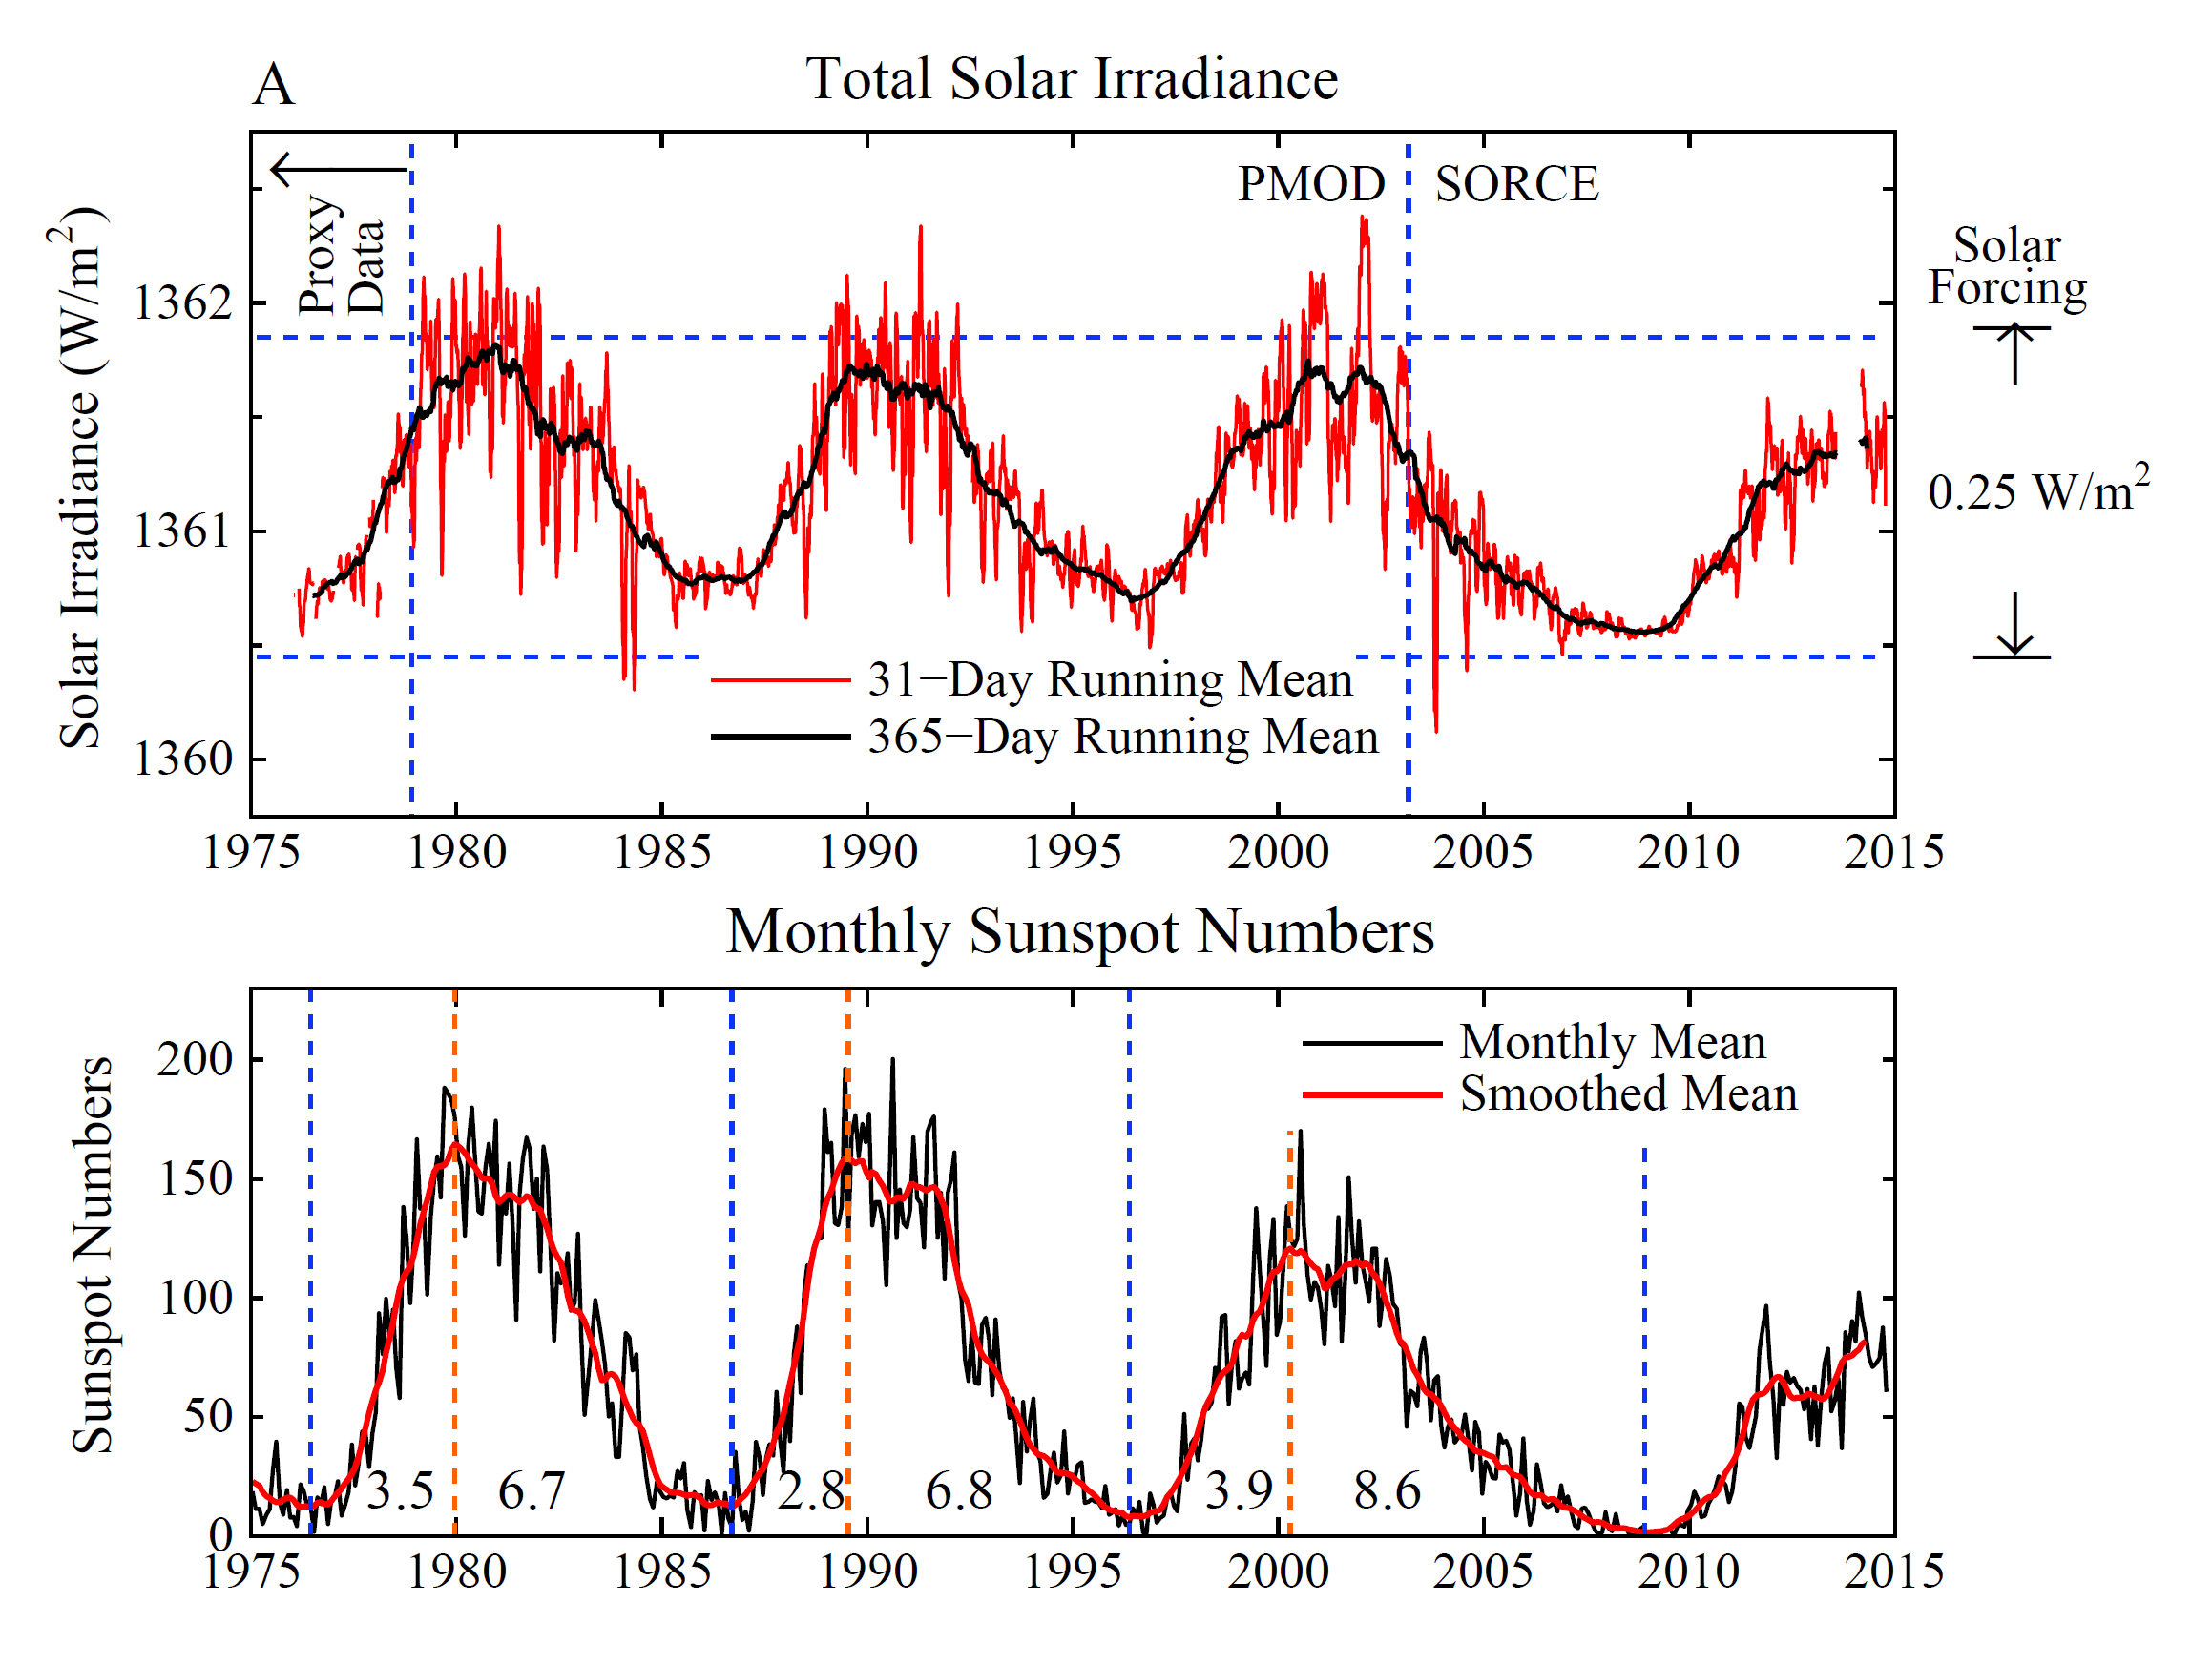
English: These two graphs show changes in total solar irradiance (TSI, labelled "A") and monthly sunspot numbers ("B") between approximately 1975 to 2013. TSI is measured in watts per square metre (W.m-2), with 31-day and 365-day running means plotted. The 31-day mean shows more variability than the 365-day mean. Both curves show a pattern of peaks and troughs (see: solar cycle). The range of changes in solar forcing (365-day mean) over the time period is 0.25 W.m2.
Graph B plots a monthly mean and smoothed mean, with the monthly mean showing more variability than the smoothed mean. The pattern of peaks and troughs in total solar irradiance is replicated in this graph of monthly sunspot numbers. A summary of the data is given in a later section. |
| Fecha | |
| Fuente |
|
| Autor | Hansen J, Kharecha P, Sato M, Masson-Delmotte V, Ackerman F, et al. |
Data
Values are approximate. See Hansen et al. for original data sources. For TSI and monthly sunspot numbers, data are given for the 365-day mean and smoothed mean, respectively. Values are given that correspond to peaks and troughs in the curves, as well as values at the beginning and end of the time period (approximately 1977 and 2014).
| Year | TSI |
|---|---|
| 1977 | 1360.75 |
| 1981 | 1361.85 |
| 1986 | 1360.75 |
| 1991 | 1361.6 |
| 1996 | 1360.75 |
| 2001 | 1361.7 |
| 2009 | 1360.55 |
| 2013 | 1361.35 |
| Year | Sunspot No. |
|---|---|
| 1977 | 15 |
| 1980 | 160 |
| 1987 | 15 |
| 1991 | 145 |
| 1997 | 10 |
| 2001 | 105 |
| 2009 | 3 |
| 2014 | 85 |
Licencia
| Este archivo está disponible bajo la licencia Creative Commons Dedicación de Dominio Público CC0 1.0 Universal. | |
| La persona que ha asociado una obra a este documento lo dedica al dominio público mediante la cesión mundial de sus derechos bajo la ley de derechos de autor y todos los derechos legales adyacentes propios de dicha, en el ámbito permitido por ley. Puedes copiar, modificar, distribuir y reproducir el trabajo, incluso con objetivos comerciales, sin pedir aprobación del autor.
|
| Annotations | This image is annotated: View the annotations at Commons |
Historial del archivo
Haz clic sobre una fecha y hora para ver el archivo tal como apareció en ese momento.
| Fecha y hora | Miniatura | Dimensiones | Usuario | Comentario | |
|---|---|---|---|---|---|
| actual | 07:49 21 nov 2014 | | 2318 × 1746 (289 kB) | Enescot | {{Information |Description ={{en|1=These two graphs show changes in total solar irradiance (TSI, labelled "A") and monthly sunspot numbers ("B") between approximately 1975 to 2013. TSI is measured in wa... |
Usos del archivo
Las siguientes páginas usan este archivo:
Uso global del archivo
Las wikis siguientes utilizan este archivo:
- Uso en de.wikipedia.org
- Uso en ga.wikipedia.org