
Archivo:Energy change inventory, 1971-2010.svg

Ver la imagen en su resolución original ((Imagen SVG, nominalmente 525 × 365 pixels, tamaño de archivo: 2 kB))
Resumen
| Descripción |
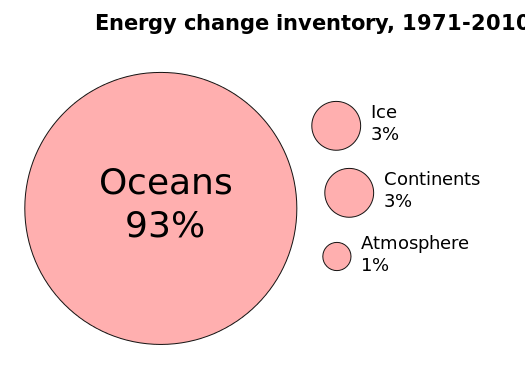
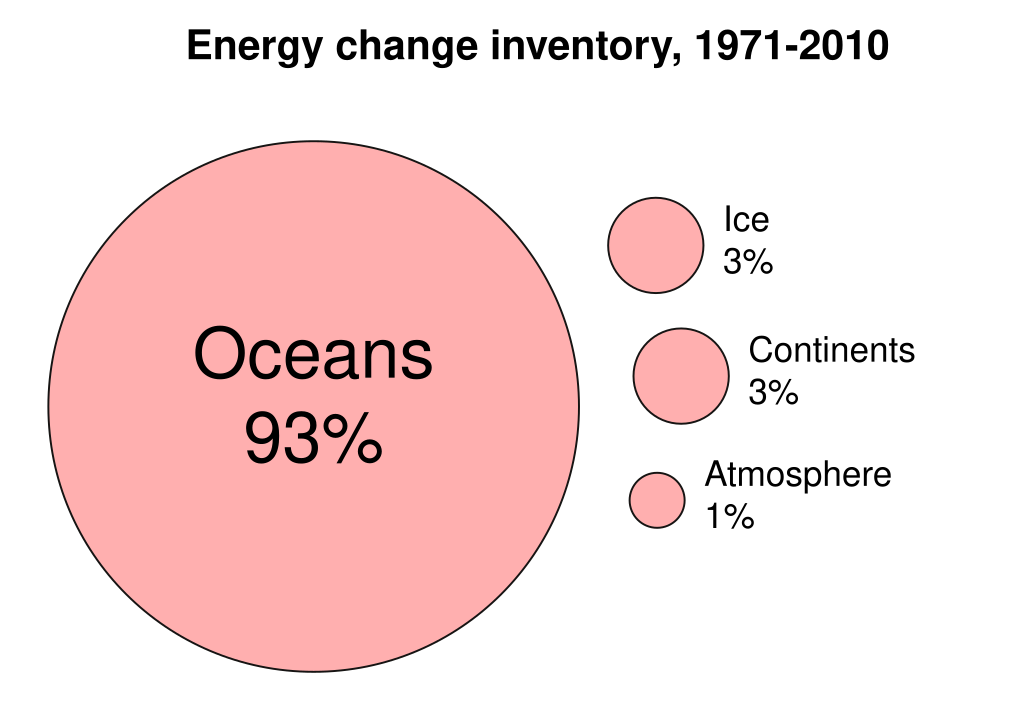
English: This bubble graph shows how the extra energy trapped by anthropogenic (i.e., human) greenhouse gases has been distributed on the Earth. This is referred to as "radiative imbalance", where less energy leaves Earth's atmosphere than enters it. Earth has been in radiative imbalance since at least the 1970s. Most of this extra energy has been absorbed by the oceans.
Data The following data shows how the extra energy trapped mainly by anthropogenic greenhouse gases has been distributed on the Earth between 1971 and 2010:
The biggest uncertainty is found in the energy invertory of the deep ocean (more than 700 m) due to a scarcity of data points. The deep ocean accounts for 29% procent of the total extra energy trapped. Further information can be found in the source listed in the references section. References
|
| Fecha | |
| Fuente | Trabajo propio |
| Autor | Enescot |
| Otras versiones |
 |
Comma-separated values
In this graph, the area of the circles is proportional to the sink's absorption of energy. The radius of the circles equals the square root of (area / π).
Data were exported from OpenOffice.org 4.0.0 Calc as comma separated values (csv). The following options were used:
- Character set: Western Europe 1252
- Field delimiter: ,
- Text delimiter: "
- Quote all text cells: no
- Save cell content as shown: yes
- Fixed column width: no
Sink,a=area,r=radius,d=diameter
Oceans,93,5.4408473067,10.8816946134
Ice,3,0.9772050238,1.9544100476
Continents,3,0.9772050238,1.9544100476
Atmosphere,1,0.5641895835,1.1283791671
Licencia
| Este archivo está disponible bajo la licencia Creative Commons Dedicación de Dominio Público CC0 1.0 Universal. | |
| La persona que ha asociado una obra a este documento lo dedica al dominio público mediante la cesión mundial de sus derechos bajo la ley de derechos de autor y todos los derechos legales adyacentes propios de dicha, en el ámbito permitido por ley. Puedes copiar, modificar, distribuir y reproducir el trabajo, incluso con objetivos comerciales, sin pedir aprobación del autor.
|
Historial del archivo
Haz clic sobre una fecha y hora para ver el archivo tal como apareció en ese momento.
| Fecha y hora | Miniatura | Dimensiones | Usuario | Comentario | |
|---|---|---|---|---|---|
| actual | 07:55 15 abr 2015 | | 525 × 365 (2 kB) | Mikima | fixed font rendering |
| 07:04 7 nov 2013 |  | 656 × 456 (31 kB) | Enescot | User created page with UploadWizard |
Usos del archivo
Las siguientes páginas usan este archivo:
Uso global del archivo
Las wikis siguientes utilizan este archivo:
- Uso en nl.wikipedia.org