
Archivo:Top Oil Producing Countries.png

Tamaño de esta previsualización: 551 × 600 píxeles. Otras resoluciones: 221 × 240 píxeles · 441 × 480 píxeles · 681 × 741 píxeles.
Ver la imagen en su resolución original (681 × 741 píxeles; tamaño de archivo: 28 kB; tipo MIME: image/png)
Resumen
| Descripción |
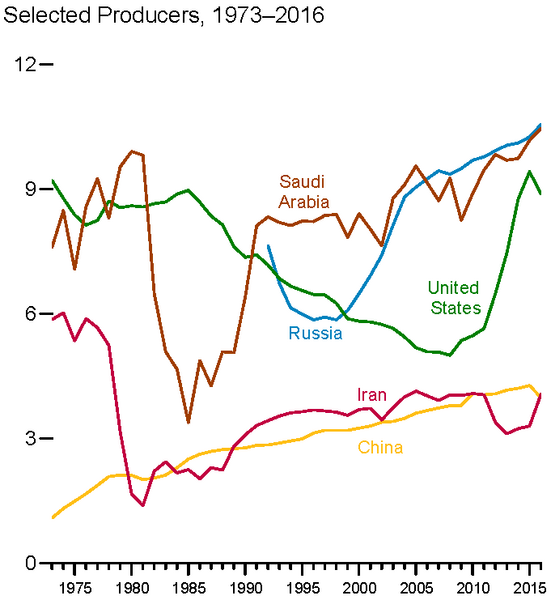
Top Oil-Producing Countries (Crude Oil including Gas Condensate, million barrels per day, 1973–2016) |
||
| Fecha | |||
| Fuente | https://www.eia.gov/totalenergy/data/monthly/archive/00351705.pdf (Monthly Energy Review, May 2017, Figure 11.1a) | ||
| Autor | U.S. Energy Information Administration | ||
| Otras versiones |
Chart based on https://www.eia.gov/totalenergy/data/monthly/archive/00351705.pdf (Monthly Energy Review, May 2017, Table 11.1a): Note that the graph has less data than the PNG image for the years 1973-1995. The later years should be identical. |

Licencia
| This image is a work of a United States Department of Energy (or predecessor organization) employee, taken or made as part of that person's official duties. As a work of the U.S. federal government, the image is in the public domain.
Please note that national laboratories operate under varying licences and some are not free. Check the site policies of any national lab before crediting it with this tag.
|

|
Historial del archivo
Haz clic sobre una fecha y hora para ver el archivo tal como apareció en ese momento.
| Fecha y hora | Miniatura | Dimensiones | Usuario | Comentario | |
|---|---|---|---|---|---|
| actual | 23:01 28 may 2017 | | 681 × 741 (28 kB) | Patrug | another year of data |
| 18:41 1 may 2016 |  | 701 × 753 (27 kB) | Patrug | another year of data | |
| 00:07 6 dic 2015 |  | 677 × 734 (26 kB) | Patrug | 9 years of newer data | |
| 19:24 26 ene 2008 |  | 465 × 472 (32 kB) | Halgin | {{Information |Description= Top Oil Producing Counties 1960-2006 |Source= Energy Information Administration / Annual Energy Review 2006 |Date= July 2007 |Author= US Department of Energy, Energy Information Administration |Permission= |other_versions= }} |
Usos del archivo
Las siguientes páginas usan este archivo:
Uso global del archivo
Las wikis siguientes utilizan este archivo:
- Uso en ar.wikipedia.org
- Uso en ca.wikipedia.org
- Uso en cs.wikipedia.org
- Uso en el.wikipedia.org
- Uso en en.wikipedia.org
- Uso en en.wikibooks.org
- Uso en eo.wikipedia.org
- Uso en eu.wikipedia.org
- Uso en fa.wikipedia.org
- Uso en fi.wikipedia.org
- Uso en hy.wikipedia.org
- Uso en id.wikipedia.org
- Uso en kk.wikipedia.org
- Uso en ko.wikipedia.org
- Uso en ml.wikipedia.org
- Uso en ms.wikipedia.org
- Uso en my.wikipedia.org
- Uso en ne.wikipedia.org
- Uso en pl.wikipedia.org
- Uso en pl.wiktionary.org
- Uso en pt.wikipedia.org
- Uso en ru.wikipedia.org
- Uso en simple.wikipedia.org
- Uso en sl.wikipedia.org
- Uso en th.wikipedia.org
- Uso en tr.wikipedia.org
- Uso en uk.wikipedia.org
- Uso en uz.wikipedia.org
- Uso en vec.wikipedia.org
- Uso en vi.wikipedia.org
- Uso en www.wikidata.org
- Uso en zh.wikipedia.org
Ver más uso global de este archivo.