
Archivo:Total US Federal Debt by President (1940 to 2015).png
Ver la imagen en su resolución original (916 × 589 píxeles; tamaño de archivo: 26 kB; tipo MIME: image/png)
Resumen
| Descripción |
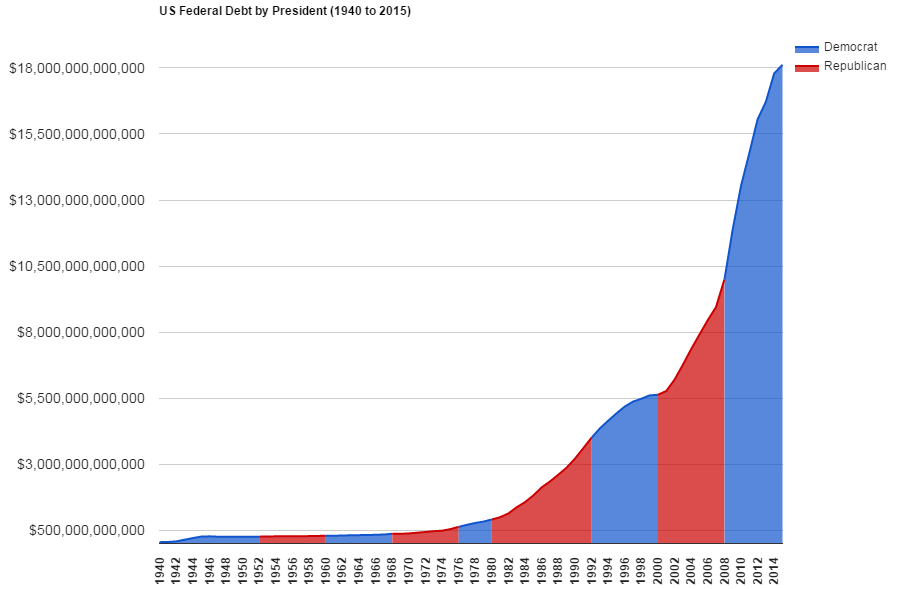
English: A chart, created using Google Spreadsheets, depicting the total U.S. federal debt from 1940 to 2014. Presidential terms of Democratic (blue) and Republican (red) presidents are shown.
|
| Fecha | |
| Fuente | Trabajo propio |
| Autor | SColombo based on style & updated datasource of previous version by Ninjatacoshell. White House recently released final (non-projected) data through 2014 & projections through 2020. |
| Otras versiones |
|
.png)
.png)
.png)
.png?uselang=es)
Licencia
- Eres libre:
- de compartir – de copiar, distribuir y transmitir el trabajo
- de remezclar – de adaptar el trabajo
- Bajo las siguientes condiciones:
- atribución – Debes otorgar el crédito correspondiente, proporcionar un enlace a la licencia e indicar si realizaste algún cambio. Puedes hacerlo de cualquier manera razonable pero no de manera que sugiera que el licenciante te respalda a ti o al uso que hagas del trabajo.
- compartir igual – En caso de mezclar, transformar o modificar este trabajo, deberás distribuir el trabajo resultante bajo la misma licencia o una compatible como el original.

|
Se autoriza la copia, distribución y modificación de este documento bajo los términos de la licencia de documentación libre GNU, versión 1.2 o cualquier otra que posteriormente publique la Fundación para el Software Libre; sin secciones invariables, textos de portada, ni textos de contraportada. Se incluye una copia de la dicha licencia en la sección titulada Licencia de Documentación Libre GNU. |
Historial del archivo
Haz clic sobre una fecha y hora para ver el archivo tal como apareció en ese momento.
| Fecha y hora | Miniatura | Dimensiones | Usuario | Comentario | |
|---|---|---|---|---|---|
| actual | 21:39 26 feb 2016 | | 916 × 589 (26 kB) | SColombo | Removed the whitespace that I'd inadvertently added in the last revision. |
| 21:35 26 feb 2016 |  | 916 × 589 (26 kB) | SColombo | Updated to include the finalized 2015 data. Will try to rename image soon. | |
| 15:26 12 feb 2015 |  | 916 × 589 (24 kB) | SColombo Commons | Updated to include final (non-projected) 2014 numbers which were recently released by the White House. | |
| 23:32 12 mar 2014 |  | 955 × 574 (21 kB) | SColombo Commons | Updated to current data. As of this week, data is now available through 2013 from the White House Office of Management and Budget http://www.whitehouse.gov/omb/budget/Historicals/ so the chart is now updated through 2013. The dataset includes projecte... | |
| 23:32 12 mar 2014 |  | 955 × 574 (21 kB) | SColombo Commons | Updated to current data. As of this week, data is now available through 2013 from the White House Office of Management and Budget http://www.whitehouse.gov/omb/budget/Historicals/ so the chart is now updated through 2013. The dataset includes projecte... | |
| 23:32 12 mar 2014 |  | 955 × 574 (21 kB) | SColombo Commons | Updated to current data. As of this week, data is now available through 2013 from the White House Office of Management and Budget http://www.whitehouse.gov/omb/budget/Historicals/ so the chart is now updated through 2013. The dataset includes projecte... | |
| 23:32 12 mar 2014 |  | 955 × 574 (21 kB) | SColombo Commons | Updated to current data. As of this week, data is now available through 2013 from the White House Office of Management and Budget http://www.whitehouse.gov/omb/budget/Historicals/ so the chart is now updated through 2013. The dataset includes projecte... | |
| 17:22 5 oct 2010 |  | 1310 × 951 (41 kB) | Ninjatacoshell | {{Information |Description={{en|1=A graph, created using Microsoft Excel, depicting the U.S. federal debt from 1940 to 2009, as a percentage of gross domestic product (GDP). Presidential terms of Democratic (blue) and Republican (red) presidents are shown |
Usos del archivo
La siguiente página usa este archivo:
Uso global del archivo
Las wikis siguientes utilizan este archivo:
- Uso en cs.wikipedia.org
- Uso en de.wikipedia.org
- Uso en fr.wikipedia.org
- Uso en pl.wikipedia.org
- Uso en sv.wikipedia.org
- Uso en vi.wikipedia.org
.png)